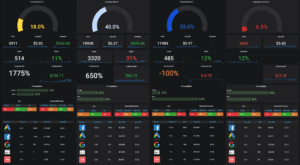
Before we explore how KPI dashboards help average digital marketers become great ones, let’s first break it down by reviewing the definitions for each term: KPI and dashboard.
Definition of Key Performance Indicator (KPI)
KPI’s are measurable results over a defined timeframe that indicate whether the business is achieving its goals. A common KPI example is unit sales by week compared to the company’s sales goal. Typically it’s stated as a % of goal (e.g., the difference between this week’s sales and the weekly goal, divided by the weekly goal). However, KPI’s measure more than sales performance alone. Companies track various key performance indicators based on their strategic priorities. Often, they want to “move the needle” on metrics that improve customer experience or operational performance, such as, increasing customer satisfaction scores, reducing customer churn, increasing average profit margin, etc.
Typically, a company must monitor more than just one KPI to fully understand the health of the business. For example, let’s say a company who’s in its early-growth stage has a goal of growing their customer base. Depending on how long the company has been in business, they may look at % growth of new clients week-by-week or year-over-year. Of course, this KPI alone is not enough to confidently say that their customer base is growing, because they could be adding customers just as fast as they’re losing them. Therefore, in addition to the % customer growth KPI, they would also want to simultaneously monitor % customer loss (or churn) and/or total customer count based recency of purchase.
Each business and industry is different, so KPI’s that make sense for one company may not make sense for the next. In fact, two companies competing in the same industry might have different KPI’s depending on their market position, priorities, and the actions they believe will help their income. Let’s compare the early-growth stage company mentioned earlier to a well-established company in the same industry. This well-established company has a large customer base in a saturated marketplace with little room to grow. In this case, the company has the strategic priority to get more sales revenue from their existing customer base. Therefore, a KPI that aligns to this strategic priority is customer purchase frequency (e.g., how many units customers bought in a given week vs. the same week in a previous period). That’s not to say this company would completely ignore customer growth – they’ll want to keep an eye on it just to be certain there are no drastic changes that signal a cause for concern.
Given every person and company has limited time and capacity, it’s not possible to monitor or even make sense of every possible KPI; it’s just too much data. Therefore, picking the right KPI’s for a business just comes down to what the company believes to be the most important indicators to get their company in a better position over time.
Definition of Dashboard
Now that we’ve reviewed the definition of KPI, let’s take a look at the second part of the equation – the dashboard. This may be obvious to most people, but a dashboard summarizes various information in well-organized, bite-sized pieces that highlight trends and/or signal changes. Dashboards are valuable in situations where a lot of information needs to be summarized for easy consumption. Great dashboards will also alert the user of any critical problems, even some that are not visible. Consider a vehicle’s dashboard and the information the instrument panel provides that can be seen and experienced, such as: speed, acceleration, miles driven, etc. However, just as important (arguably more important) are the alerts for not-so-obvious issues, like low tire pressure, low oil level, etc. These are issues that, if not addressed immediately, could cause permanent and expensive damage to your car.
The same is true in business – there are certain changes in trends and customer behavior that, if go unnoticed or ignored, can be detrimental to business performance. However, admittedly this analogy falls a little short, because in business and especially in marketing, there’s also hidden positive patterns and trends that, if recognized and acted upon, can improve the performance of the company. This is where KPI dashboards come in.
KPI Dashboards
Let’s put it all together. KPI’s are the measurables that tell a company whether they’re tracking towards their goals and dashboards summarize information so it’s understandable. So together, KPI dashboards identify how well a company is progressing towards its goals and offer insights to help users make well-informed decisions. In other words, a good dashboard doesn’t just tell you “what” has changed in an easy-to-understand format, it also tells you “why”.
For digital marketers, this type of timely, digestible information is priceless. Digital marketers don’t have the luxury to spend a lot of time digging through a sea of data to understand what’s working and what’s not. What’s more, a lot of factors influence customer behavior, so understanding marketing campaign performance is often difficult to nail down by looking at just a single metric or even several metrics simultaneously. Therefore, knowing which KPI’s to monitor is key. If a digital marketer follows metrics that don’t matter or don’t tell the whole story, they may be misguided and/or remain just as lost as they would be without the KPI dashboard.
This is why Atlas AI stands above other KPI dashboard solutions. Atlas AI not only aggregates customer data from multiple sources to give digital marketers access to powerful KPI’s that would normally cost too much time or money to measure, Atlas AI helps digital marketers determine which KPI’s matter most to guide their decisions. These insights can turn any average digital marketer into a great one. Even a super star! How does Atlas AI do this? Learn more here.


